Let’s find out the performance
Somebody, who wants to use skywalking, has concerns about the performance of our auto-instrument agent. The applications, inside this repository, will be used to test performance of our agent.
All tests use skywalking 3.2 javaagent. We used jmeter to run performance test in a physical machine, which has 4 Intel(R) Core(TM) i5-4460 CPU @ 3.20GH, 16G memory, and the OS is CentOS Linux release 7.2.1511 (Core).
Baseline
The baseline is running the benchmarks without skywalking agent. And provide these:
- CPU: Percent of the running machine, we prefer to do this in physical machine.
- TPS: Transaction per second.
- Response Time. Unit: millisecond
Running with agent
The same metrics are collected with the baseline.
Agent Cost
Agent Cost = Running with agent - Baseline
Benchmarks
Benchmark-1
This is a very common Spring-based system, which includes Spring Boot, Spring MVC, simulate-redis-client, HikariCP connection pool(with simulate-mysql-client). About this application, agent will trace 5 spans(1 Tomcat, 1 SpringMVC, 2 Jedis, 1 Mysql) for each transaction.
Please notice: we used the simulate-*-client to simulate the client lib, instead the real client library, in order to avoid effections of server-side and network performance.
e.g. The network and config of mysql/redis server are effecting the client performance, but this isn’t our testing purpose.
High (nearly impossible) throughputs
We simulated 500 users to access the application, with 10ms thought time. Because our application is so fast, the result is about more than 5000 transactions per second during the test.
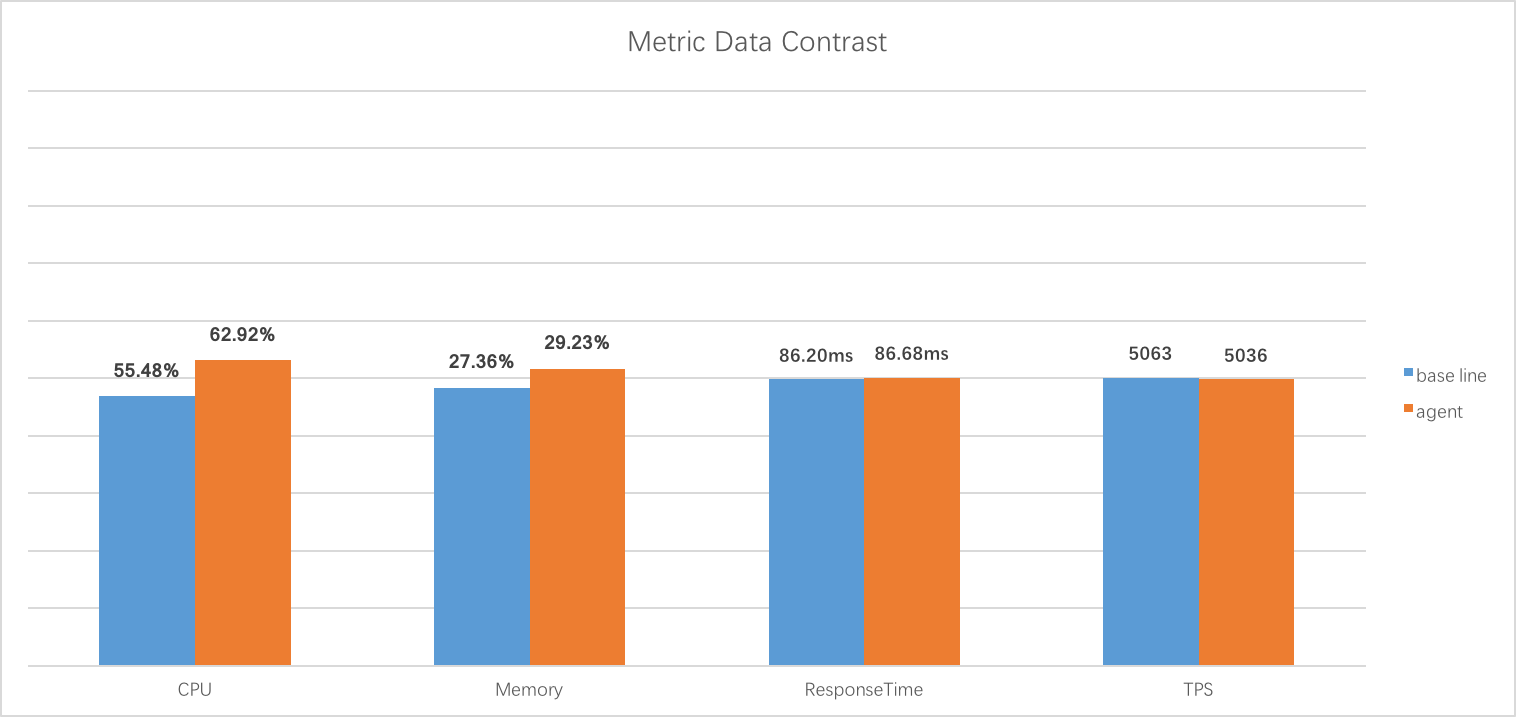
The agent increases 10% CPU cost in a 220%+ CPU cost application, without needing any sampling mechanism, to collect 5000+ trace segments per second and send them to our collector through network. Clearly, skywalking agent is a very high efficiency agent. As you known, nearly no single-process application can do this in a x86 server, except for something likes cache(redis)-proxy server. And for tps and response time, the agent effects nearly nothing.
This means, even agent costs a little CPU in a high throughputs server, but wouldn’t effect performance during tracing.
To be honest, a single instance of most applications is just running in 100-1200 tps, as I known, even in the powerful Chinese telecom system or e-commerce system. So, you shouldn’t have any concern about performance for using our agent to trace your application.
Go to the details of CPU, memory, tps and response time graph for benchmark-1
Benchmark-2
The application is similar with benchmark-1, but we did some adjustments, to make it more reality. As I said, benchmark-1 is just for proving of limitation. So, we simulated 300 users to access the application, and keep the tps near 1000, which is also very high. The CPU cost clearly is less than before, which is only 6%.
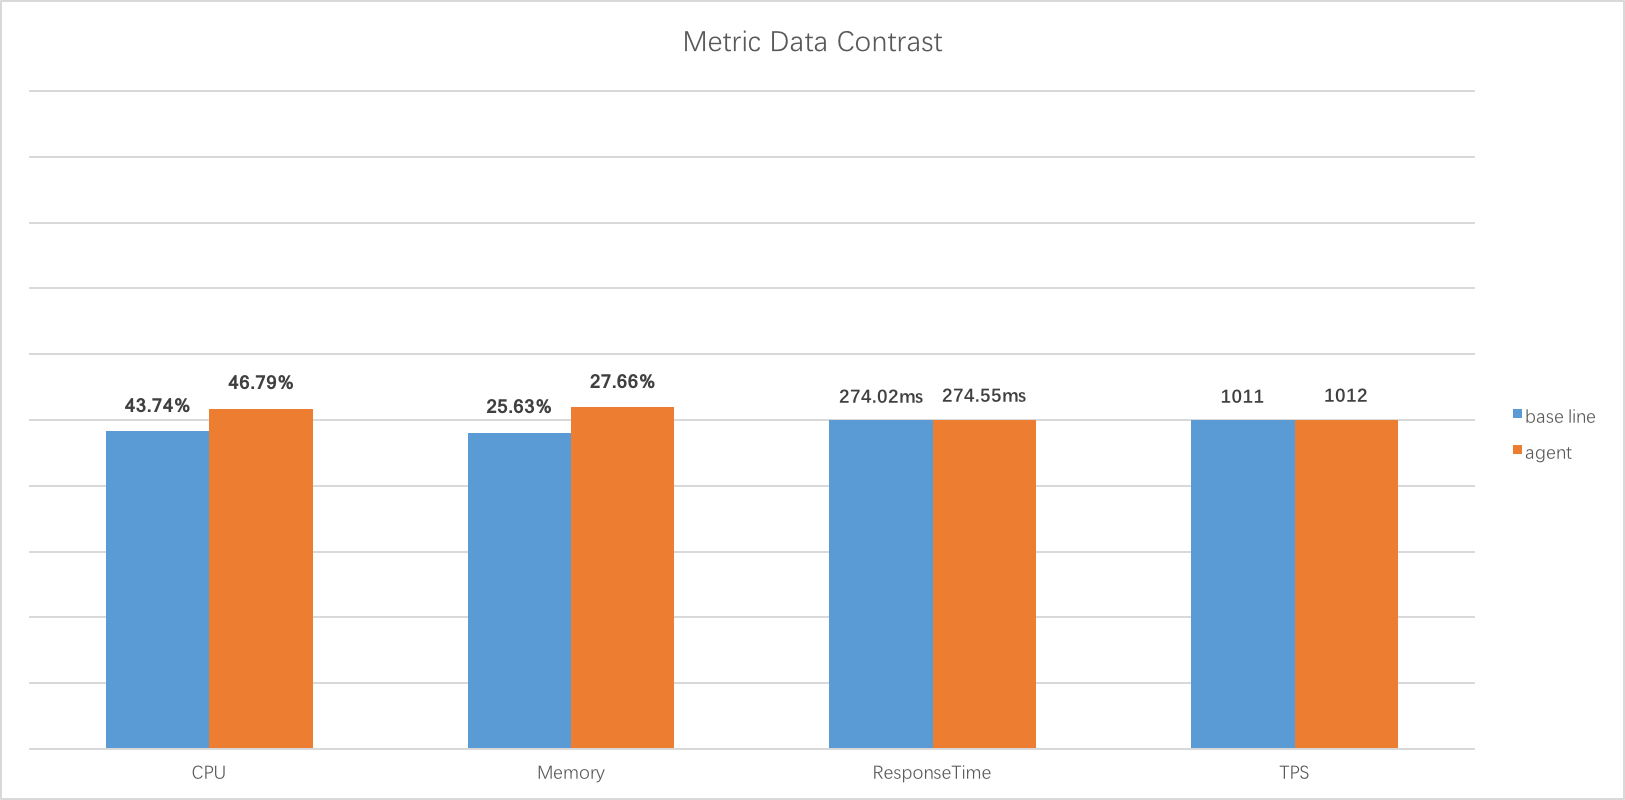
You can see, we wouldn’t effect the tps and reponse time either.
Go to the details of CPU, memory, tps and response time graph for benchmark-2
Paranoea benchmarks
Why called Paranoea benchmarks? All these benchmarks are from @ascrutae suggestions, I called him insane. These benmarks are simulating more impossible scenarios in product env. Each benchmark will explain How insame it is.
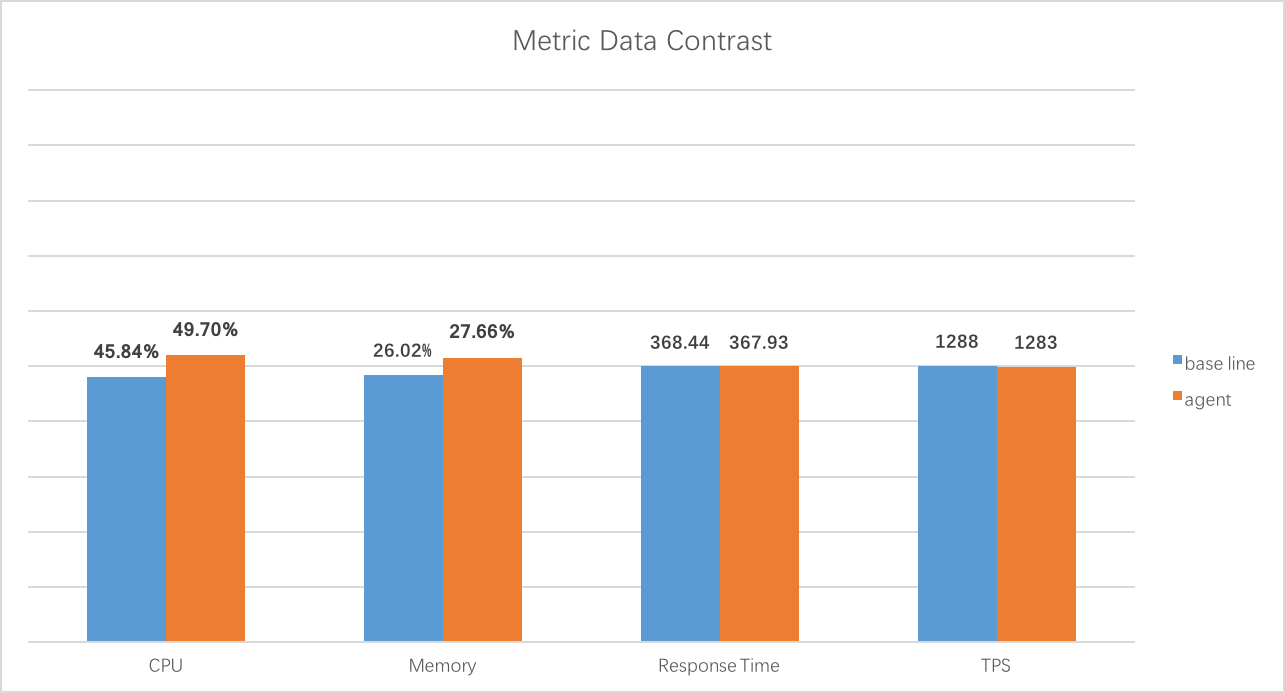
Benchmark-3
This is the first Paranoea benchmarks. The backgroupd story is that, the application costs 80%+ CPU, also 5000tps, and you want to trace it. As I known, nobody or no-company allow the server running under such high load.
And thank god, lucky, because of our good design agent core, it survived in such scenario. Let’s see the result:

Go to the details of CPU, memory, tps and response time graph for benchmark-3
Benchmark-4
This application is hard to say, whether is reality or not. @ascrutae said, maybe 5 spans for each transaction is too little, real system may do more. So he make this simulation, which includes 20 spans: 1 SpringMVC, 2 Jedis, 7 Annotation Trace and 10 Mysql. And also keep the tps about 1300. 7 @Trace annotation spans and 10 mysql db spans for each transaction are much more than you usually did. But ascrutae assists to do so… fine… let’s find out.
Go to the details of CPU, memory, tps and response time graph for benchmark-4
Again and again, the benchmarks had proved that, the limitation of agent is even higher than you need. So don’t worry about the performance of our agent. Trace your applications as you need.